OK.Wahl
Internetpräsentation
Version 2.2.12
Ergebnis zur Bezirkswahl 2013 am 15.09.2013
Wahlkreis Mittelfranken - Stimmkreis Nürnberg-Süd
Es wurden alle Stimmbezirke ausgewertet.
 Diagramm
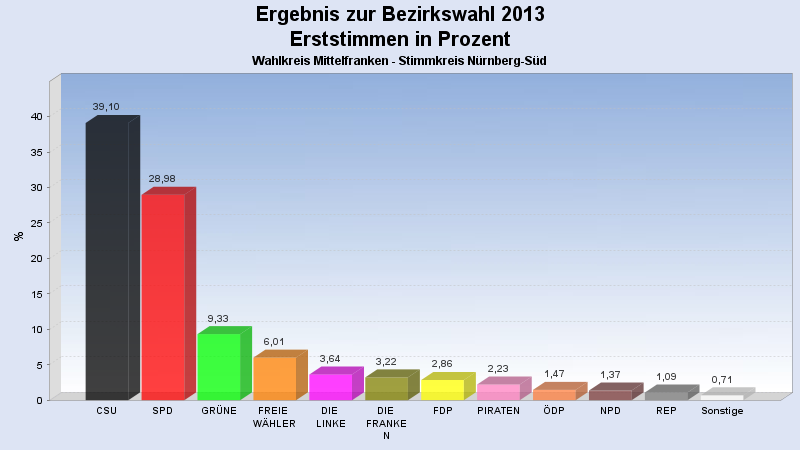
 Seitenanfang
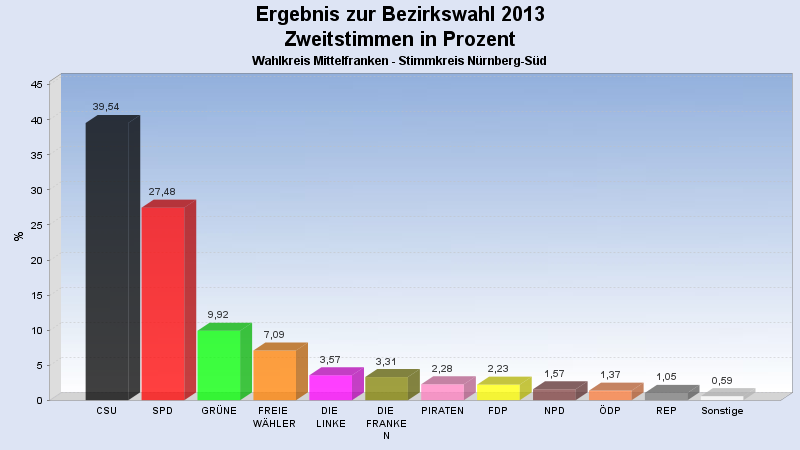
Wahlbeteiligung, Stimmzettel, Stimmen
| Wahlbeteiligung: | 61,29% |
|---|---|
| Stimmberechtigte: | 100.280 |
| Wähler: | 61.458 |
| Ungültige Erststimmen: | 1.261 |
| Gültige Erststimmen: | 59.108 |
| Ungültige Zweitstimmen: | 1.192 |
| Gültige Zweitstimmen: | 59.171 |
Erststimmen nach Wahlvorschlag
| Partei | Erststimmen | Prozent | |
|---|---|---|---|
| 1 | Forster, Peter Daniel (CSU) | 23.113 | 39,10% |
| 2 | Reiß, Peter (SPD) | 17.130 | 28,98% |
| 4 | Häring, Heike (GRÜNE) | 5.513 | 9,33% |
| 3 | Schubert, Thomas (FREIE WÄHLER) | 3.551 | 6,01% |
| 6 | Ziegler, Ernst (DIE LINKE) | 2.154 | 3,64% |
| 11 | Gansmann, Hannsjochen (DIE FRANKEN) | 1.902 | 3,22% |
| 5 | Schmauser, Harald R. (FDP) | 1.688 | 2,86% |
| 12 | Klier, Andrea-Susanne (PIRATEN) | 1.321 | 2,23% |
| 7 | Schindler, Hermann (ÖDP) | 866 | 1,47% |
| 9 | Schelle, Gerhard (NPD) | 807 | 1,37% |
| 8 | Grüner, Anton (REP) | 646 | 1,09% |
| 10 | Gerken, Lars (BP) | 417 | 0,71% |
Zweitstimmen nach Wahlvorschlag
| Partei | Zweitstimmen | Prozent | |
|---|---|---|---|
| 1 | CSU | 23.394 | 39,54% |
| 2 | SPD | 16.262 | 27,48% |
| 4 | GRÜNE | 5.869 | 9,92% |
| 3 | FREIE WÄHLER | 4.196 | 7,09% |
| 6 | DIE LINKE | 2.114 | 3,57% |
| 11 | DIE FRANKEN | 1.958 | 3,31% |
| 12 | PIRATEN | 1.350 | 2,28% |
| 5 | FDP | 1.318 | 2,23% |
| 9 | NPD | 930 | 1,57% |
| 7 | ÖDP | 812 | 1,37% |
| 8 | REP | 619 | 1,05% |
| 10 | BP | 349 | 0,59% |
- Stand: 26.07.2018 11:12:41