OK.Wahl
Internetpräsentation
Version 2.2.12
Vorläufiges Ergebnis zur Bezirkswahl 2018 am 14.10.2018
Wahlkreis Mittelfranken - Stimmkreis Nürnberg-Nord
Es wurden alle Stimmbezirke ausgewertet.
 Diagramm
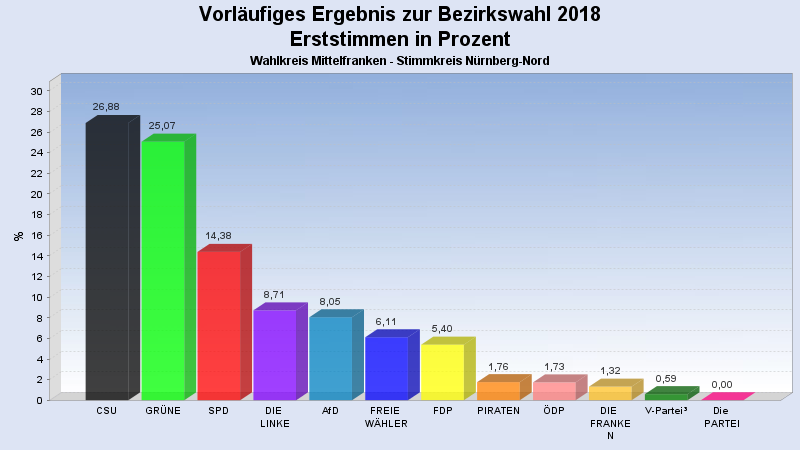
 Seitenanfang
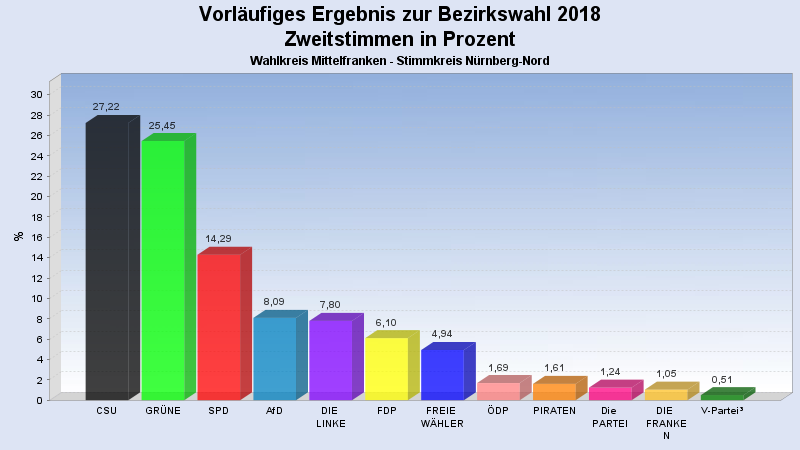
Wahlbeteiligung, Stimmzettel, Stimmen
| Wahlbeteiligung: | 71,33% |
|---|---|
| Stimmberechtigte: | 102.676 |
| Wähler: | 73.240 |
| Ungültige Erststimmen: | 722 |
| Gültige Erststimmen: | 72.302 |
| Ungültige Zweitstimmen: | 878 |
| Gültige Zweitstimmen: | 72.130 |
Erststimmen nach Wahlvorschlag
| Partei | Erststimmen | Prozent | |
|---|---|---|---|
| 1 | Seel, Catrin (CSU) | 19.437 | 26,88% |
| 4 | Arnold, Daniel (GRÜNE) | 18.125 | 25,07% |
| 2 | Dr. Krömker, Horst (SPD) | 10.395 | 14,38% |
| 6 | Schüller, Titus (DIE LINKE) | 6.301 | 8,71% |
| 10 | Görnert, Dieter (AfD) | 5.817 | 8,05% |
| 3 | Nether, Heinz (FREIE WÄHLER) | 4.420 | 6,11% |
| 5 | Bachmann, Sebastian (FDP) | 3.904 | 5,40% |
| 8 | Gruber, Eva-Elisabeth (PIRATEN) | 1.275 | 1,76% |
| 7 | Kamolz, Sarah (ÖDP) | 1.250 | 1,73% |
| 9 | Dr. Bartlitz, David (DIE FRANKEN) | 955 | 1,32% |
| 12 | Garratt, Daniel (V-Partei³) | 423 | 0,59% |
Zweitstimmen nach Wahlvorschlag
| Partei | Zweitstimmen | Prozent | |
|---|---|---|---|
| 1 | CSU | 19.635 | 27,22% |
| 4 | GRÜNE | 18.355 | 25,45% |
| 2 | SPD | 10.307 | 14,29% |
| 10 | AfD | 5.838 | 8,09% |
| 6 | DIE LINKE | 5.626 | 7,80% |
| 5 | FDP | 4.398 | 6,10% |
| 3 | FREIE WÄHLER | 3.561 | 4,94% |
| 7 | ÖDP | 1.220 | 1,69% |
| 8 | PIRATEN | 1.164 | 1,61% |
| 11 | Die PARTEI | 898 | 1,24% |
| 9 | DIE FRANKEN | 760 | 1,05% |
| 12 | V-Partei³ | 368 | 0,51% |
- Stand: 19.10.2018 11:37:40